Servicenavigation
Suche
The figure below shows the hyetographs for the ten stations measuring hourly precipitation located on the northern side of the Alps and in the northern Alps that recorded the largest cumulated precipitation between 9 and 13 August 2002. These stations are located on the Alpine north slope, on the north-eastern Plateau, as well as in the north of the Grisons.
At all stations, the precipitation was not uninterrupted but occurred in three successive phases (see sections Weather situation and Precipitation and temperature for more details). The first phase, caused by the transport of moist air from the west towards Switzerland, started during the day of 9 August and extended into the night of 9 to 10 August. It was followed a few hours later by a second phase that lasted until the evening of 10 August, this time caused by the confrontation of different air masses above Switzerland. At stations Napf, Grimsel Hospiz and Pilatus, this second phase brought the highest hourly precipitation intensity measured during the event (respectively 6.8 mm/h, 5.9 mm/h and 5.6 mm/h).
The third precipitation phase began in the early morning of 11 August and was related to the development of a low pressure area over northern Italy, causing the transport of moist air from the Mediterranean towards Switzerland from the north-east and the ascent of that air over the Alpine topography. At most stations, the precipitation reached a peak between the afternoon of 11 August and the early morning of 12 August, before decreasing rapidly. During the peak, a maximum hourly intensity of 13.7 mm/h was measured at station Säntis, 8.7 mm/h at station St. Gallen and 8.1 mm/h at station Glarus.
On 12 and 13 August, most stations recorded little or no precipitation. The stations that did record some precipitation are located in the eastern part of Switzerland (Säntis, Glarus, Weissfluhjoch and Davos) and stayed under the influence of the low pressure area a little longer than those located further to the west.
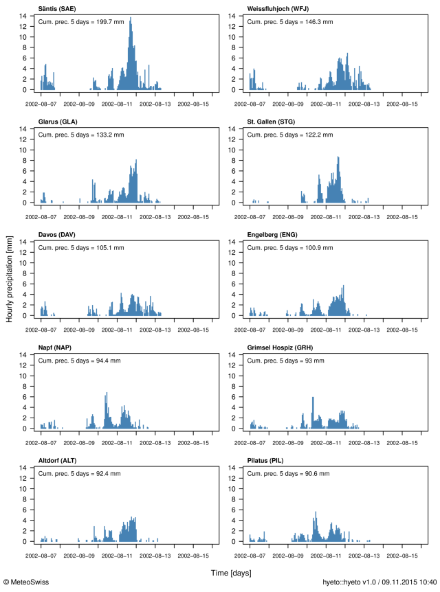
The hyetographs display hourly precipitation starting 2 days before the beginning of the event (7 August 2002) and ending 2 days after the end of the event (15 August 2002). The hourly precipitation [mm] is represented by the vertical blue bars and the date is given on the time axis, where each day begins at 00 UTC. The cumulated precipitation over the duration of the event (5 days) is indicated in the top left corner of the plots and corresponds to the precipitation measured between 9 August 2002, 05:40 UTC and 14 August 2002, 05:40 UTC.
Comparison with other heavy precipitation events
The plots in the infoboxes below show the event of 9-13 August 2002 compared with other events for stations Glarus and Säntis. For both stations, the maximum 96-hour precipitation recorded during the event corresponds to one of the five largest 96-hour precipitation sums measured in summer between 1981 and 2014, with respectively 133.2 mm and 199.7 mm observed within 96 hours.
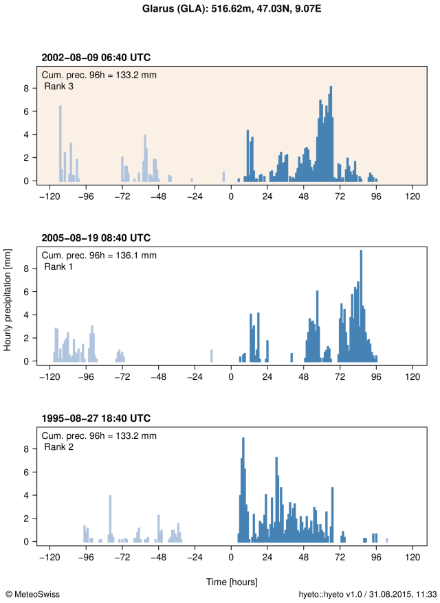
Comparison of the event (beige background) with two other large 96-hour precipitation sums (white background) that were measured at station Glarus (eastern Alpine north slope) in summer (JJA) between 1981 and 2014. The hourly precipitation [mm] is represented by vertical bars: blue during, and grey before and after the 96-hour intervals. The dates and times corresponding to the beginning of the 96-hour intervals are given above the plots and indicated by 0 on the time axis. The rank indicates the ranking of the events compared to other 96-hour precipitation sums at that station.
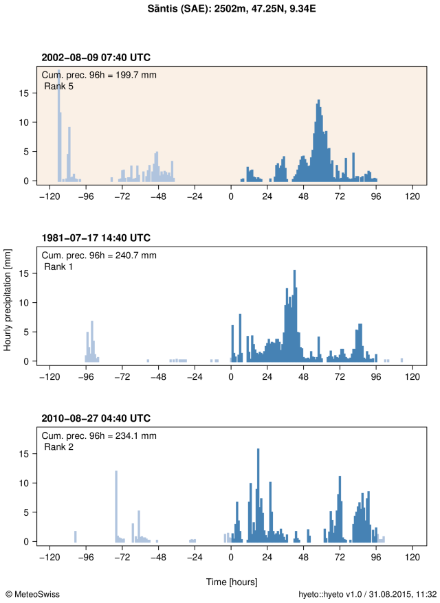
Comparison of the event (beige background) with two other large 96-hour precipitation sums (white background) that were measured at station Säntis (eastern Alpine north slope) in summer (JJA) between 1981 and 2014. The hourly precipitation [mm] is represented by vertical bars: blue during, and grey before and after the 96-hour intervals. The dates and times corresponding to the beginning of the 96-hour intervals are given above the plots and indicated by 0 on the time axis. The rank indicates the ranking of the events compared to other 96-hour precipitation sums at that station.
Moving sums of hourly precipitation cumulated over a duration interval of 96 hours are used in order to determine the highest 96-hour precipitation sums at the given stations and to determine the ranking of the event of August 2002 compared to other precipitation sums of same duration for the same season (JJA). A large 96-hour precipitation sum does not always result from one long-lasting precipitation event, but can also result from successive precipitation events separated by a certain amount of hours. Note that the starting time of the duration interval over which the cumulated precipitation is the highest can differ from one station to another.
Automatic stations measuring hourly precipitation were used to produce the hyetographs presented above. These stations are not always located, however, where the highest precipitation falls, and the daily sums are sometimes lower at the hourly stations than those measured at other stations located on the Alpine north slope that measure daily precipitation only. The tables in the boxes below show the daily precipitation for some of these stations, as well as the maximum 4-day precipitation sum between 9 and 13 August 2002. The latter can be used to compare the precipitation amounts recorded during the event with those presented above (96-hour precipitation).
| Date | SWA | KLT | TEU | INN |
|---|---|---|---|---|
09.08.2002 | 7.7 | 18.5 | 9.5 | 13.5 |
10.08.2002 | 68.8 | 25 | 47.9 | 37.3 |
11.08.2002 | 117.1 | 109.4 | 104 | 97.5 |
12.08.2002 | 11.8 | 22.8 | 3.2 | 14.4 |
13.08.2002 | 0 | 0.5 | 0 | 0.2 |
Max 4-day sum | 205.4 | 175.7 | 164.6 | 162.7 |
Daily precipitation during the event and maximum 4-day precipitation sum between 9 and 13 August 2002 (both in mm) at stations located on the eastern Alpine north slope: Schwägalp (SWA), Klöntal (KLT), Teufen (TEU) and Innerthal (INN). The sum is always calculated from 05:40 UTC of a given day to 05:40 UTC of the following day. Source: MeteoSwiss
| Date | HOY | BIS | BIS |
|---|---|---|---|
09.08.2002 | 21.4 | 12.9 | 20 |
10.08.2002 | 33.3 | 23.9 | 27.5 |
11.08.2002 | 87.1 | 94 | 92.5 |
12.08.2002 | 16.1 | 21.5 | 1 |
13.08.2002 | 1.5 | 0.2 | 0 |
Max 4-day sum | 157.9 | 152.3 | 141 |
Daily precipitation during the event and maximum 4-day precipitation sum between 9 and 13 August 2002 (both in mm) at stations located on the central Alpine north slope: Hoch Ybrig (HOY), Bisistal (BIS) and Stöckalp (STP). The sum is always calculated from 05:40 UTC of a given day to 05:40 UTC of the following day. Source: MeteoSwiss
As for stations Glarus and Säntis, for most of these stations (with the exception of Hoch Ybrig and Bisistal), the largest 4-day precipitation sum measured between 9 and 13 August 2002 also corresponds to one of the five largest 4-day precipitation sums recorded at those stations in summer between 1981 and 2014.